




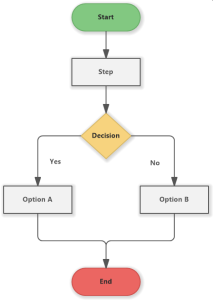
A Process Flowchart Diagram is a practical tool for visualizing the sequence of actions and decisions within a process. By representing the process from start to finish using boxes, diamonds, and arrows, teams can easily understand how work flows, identify inefficiencies, and improve collaboration.
“The secret of getting ahead is getting started. The secret of getting started is breaking your complex overwhelming tasks into small manageable tasks, and then starting on the first one.”
— Mark Twain
Step by step:
-
Define the start and end points
Clearly identify where the process begins and ends. This helps set boundaries and focus the scope of your flowchart. -
Map all actions and decisions
List every step involved in the process, including actions, decision points, and responsible individuals. Represent them visually with the appropriate symbols. -
Review and refine the diagram
Discuss the flowchart with your team or stakeholders to validate its accuracy, identify bottlenecks, and adjust where necessary.
A Process Flowchart Diagram is a simple yet powerful way to visualize and improve processes. When used collaboratively, it helps teams align their understanding, spot opportunities for optimization, and take the first step toward continuous improvement.
This post is part of a series of posts on inception related activities.