
Power vs. Interest Matrix (Stakeholder mapping)

The Power vs. Interest Matrix helps you identify and map the key influencers related to a topic. On it you will be able to define the level of power and interest of each stakeholder. It is an essential tool to help you decide the best approach on how to interact with each stakeholder.

Step by step

  1. Decide the topic under discussion (e.g. a new initiative, a workshop, a product line, a business division)
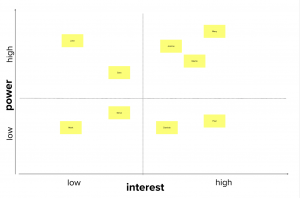
  2. Explain the four quadrants on the matrix:
    • High power – High interest: Who are the people that we should actively engage with? Who are the decision makers that have the biggest impact on the topic?
    • High power – Low Interest: Who should we actively consult? Who are the people with great power, but with little time to dedicate to the topic?
    • Low power – High interest: Who should we invite and maintain a close relationship with? Who are the people very interested in the topic, but that have low power?
    • Low power – Low interest: Who should we keep informed? Although we will not spend time and energy with excessive communication.
  3. Ask everyone to list the stakeholders and place them on the four areas
  4. Clustering and group conversation

Power vs. Interest Matrix Sample Result


>> Get this activity template on Mural


This post is part of a series of posts on inception related activities.


Paulo Caroli

Paulo Caroli is an author, speaker, and consultant specializing in agile transformations, Lean Inception, and OKRs. With over 30 years of experience—including nearly a decade in Silicon Valley and 18 years at ThoughtWorks—he has helped organizations transition from project to product and from strategy to execution. Creator of the Lean Inception methodology and author of bestselling books like Lean Inception and Team OKR, Paulo is dedicated to empowering teams to align, validate, and deliver real business value.
Team Architecture Redesign

Team Architecture Redesign

The "Team Architecture Redesign" activity is a structured process designed to help teams critically assess and revamp their current structures. It's an opportunity to compare different organizational frameworks, ultimately choosing the most fitting structure and...

read more
Process flowchart diagram

Process flowchart diagram

A Process Flowchart Diagram helps teams visualize how work flows across a process — from start to finish. Using simple shapes like boxes, diamonds, and arrows, it clarifies each action and decision point, revealing inefficiencies and opportunities for improvement. When created collaboratively, a flowchart becomes a shared tool for alignment, clarity, and continuous improvement.

read more

Pin It on Pinterest