
3-step prioritisation by impact and frequency

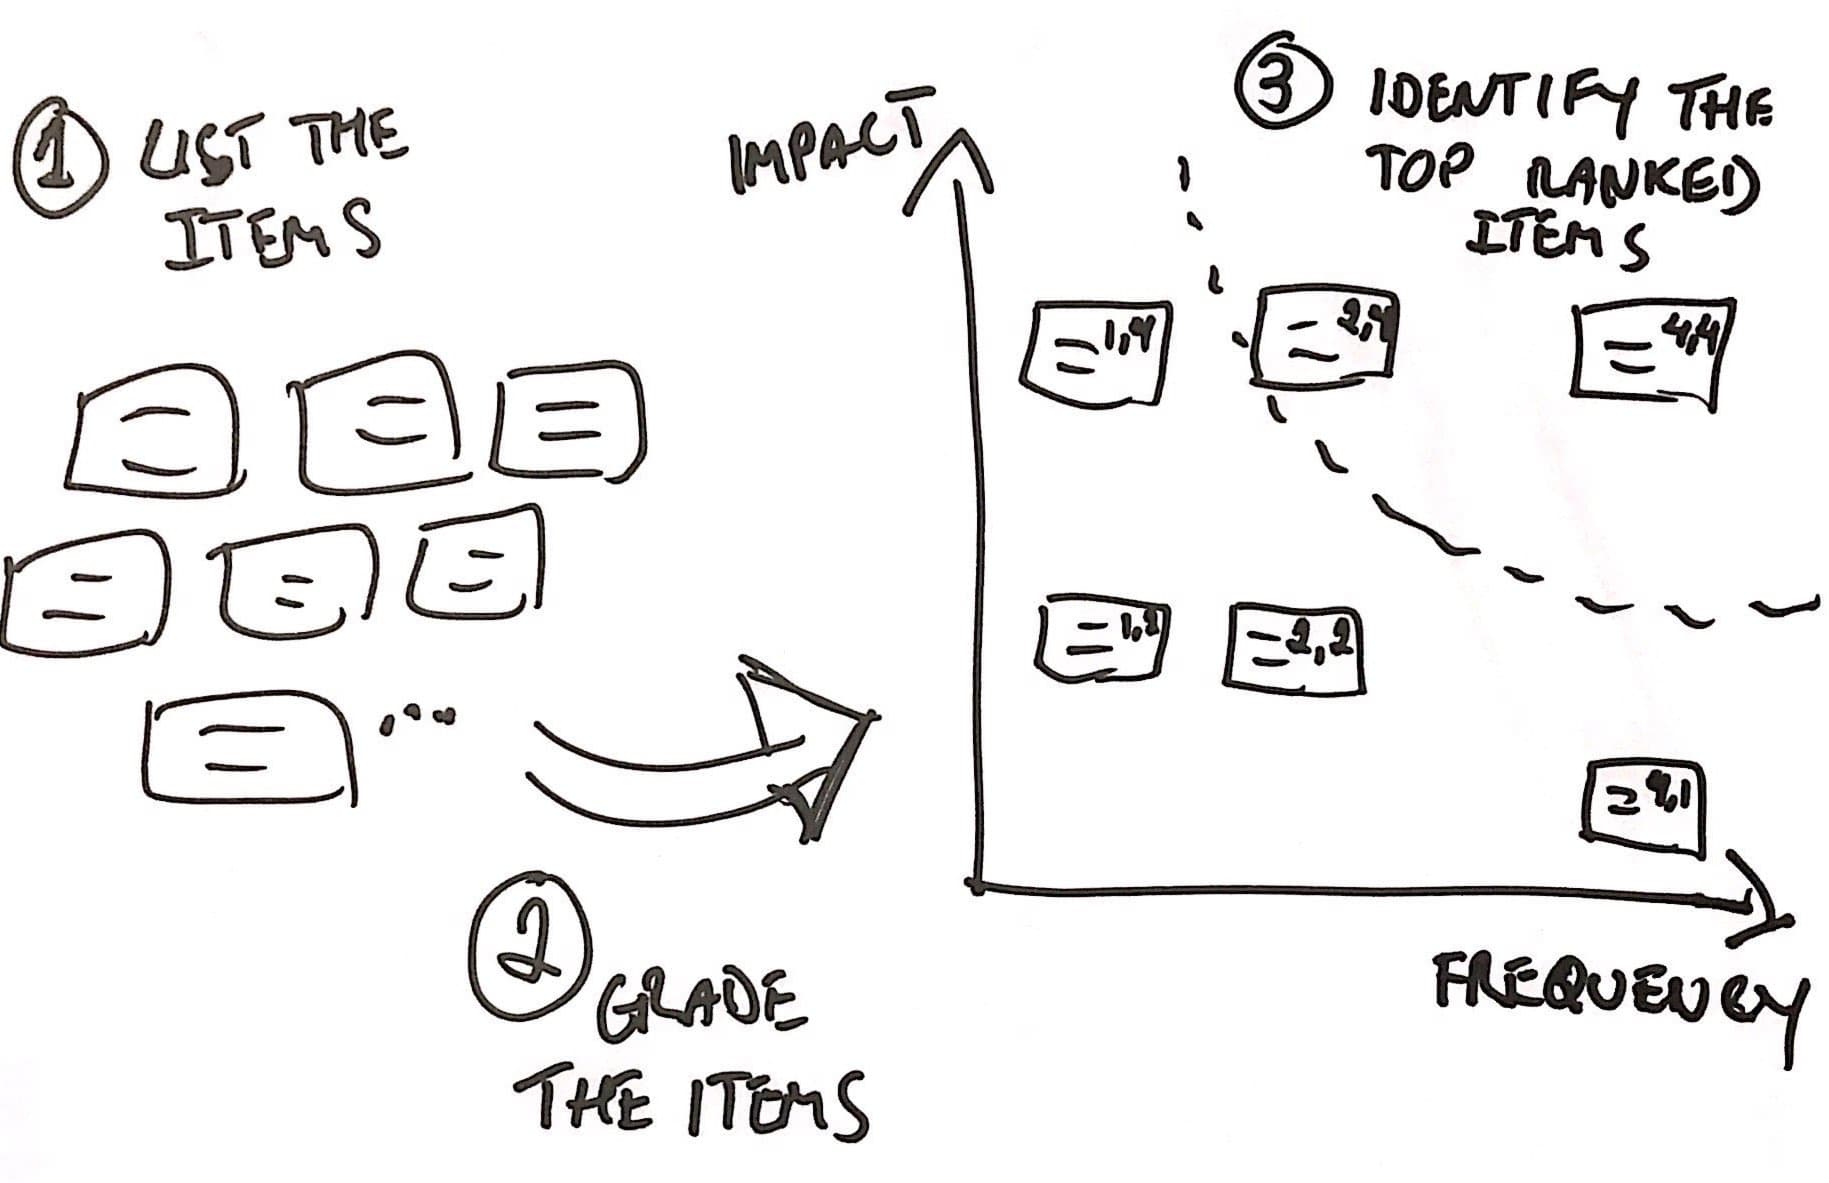
I have used the following 3 step prioritisation by impact and frequency many times, therefore I am sharing it on this post. I have learned it from Fabio Aguiar PBB’s book as he explain it in the context of prioritising Users Stories for building the product backlog. But I have used it in many instances, such as prioritising problems, objectives and activities.
 

1. List the items

Start by listing all the items. If possible on post-it or notes that can be easily moved around.

2. Grade the items

Grade all the items, comparatively to each other, in relation of impact and frequency:

  • What is the perceived impact this item has to our business?
  • What is the frequency of occurrence of this item?

If possible, move the items to the Frequency (X axis) and Impact (Y axis) graph .

3. Identify the top ranked items

Decide how many itens to be prioritised and draw the line to indicate it on the graph (the top right corner of the graph)

Paulo Caroli

Paulo Caroli is an author, speaker, and consultant specializing in agile transformations, Lean Inception, and OKRs. With over 30 years of experience—including nearly a decade in Silicon Valley and 18 years at ThoughtWorks—he has helped organizations transition from project to product and from strategy to execution. Creator of the Lean Inception methodology and author of bestselling books like Lean Inception and Team OKR, Paulo is dedicated to empowering teams to align, validate, and deliver real business value.
Team Architecture Redesign

Team Architecture Redesign

The "Team Architecture Redesign" activity is a structured process designed to help teams critically assess and revamp their current structures. It's an opportunity to compare different organizational frameworks, ultimately choosing the most fitting structure and...

read more
Process flowchart diagram

Process flowchart diagram

A Process Flowchart Diagram helps teams visualize how work flows across a process — from start to finish. Using simple shapes like boxes, diamonds, and arrows, it clarifies each action and decision point, revealing inefficiencies and opportunities for improvement. When created collaboratively, a flowchart becomes a shared tool for alignment, clarity, and continuous improvement.

read more

Pin It on Pinterest